NEW YORK CITY—Sensing the emergence of a trend in the market, CBRE began tracking “re-pricing”—defined as the change in price, either higher or lower, of listed office space—this year and found that Lower Manhattan led the re-pricing movement by almost double the rate of such activity in Midtown.
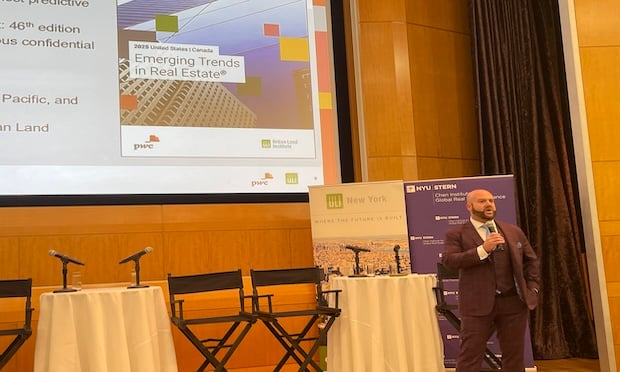
The data was revealed at the services firm's quarterly briefing, held Wednesday in Midtown. CBRE also reported that re-pricing up led the trend, while leasing activity around the city was strong in the first three months of the year.
“Overall, we had a very, very busy quarter in leasing,” stated Peter Turchin, EVP. “In total, there was 3.9 million square feet leased. If you multiply that by four, we will be at the same levels we were last year.”
In the city's three submarkets, velocity and rent growth was strong, CBRE adds. Leasing activity in Midtown totaled 3.94 million square feet, 38% higher than activity in the same period last year while, year-over-year, the average asking rent in the area was $74.27, up 7% compared to the $69.58 per square foot average reported in Q1 2013.
Midtown South started the year at a near-historic leasing pace, totaling 1.66 million square feet of activity for the first three months of the year, the highest quarter leasing total for the market since reaching 1.76 million square feel during the fourth quarter of 2001. The quarter's leasing activity was 50% higher than its five-year quarterly average of 1.11 million square feet. The availability rate in the nation's tightest submarket continued to get squeezed, finishing at 9.4% against 10.2 in the previous quarter. Asking rents remain near historical highs.
Those stratospheric heights are—at long last—pushing technology firms into other portions of the city, revealed Sacha Zarba, EVP. “With Midtown South at an all-time high and offering extremely limited availabilities, maturing tech companies are looking for new areas in which to grow their businesses. Along with growing residential communities and transportation options, Downtown Manhattan and Brooklyn are opening up as true market alternatives for tech tenants.”
Downtown, leasing continued moving at a rapid clip, with 1.62 million square feet of activity reported. The quarter's leasing total was a healthy 42% higher than the five-year quarterly average of 1.14 million square feet, marking the 12th consecutive of leasing activity higher than the five-year average. Absorption was down, at negative 1.07 million square feet, but that was driven largely by the addition of One World Trade Center into the area's inventory. Average asking rent closed at 48.70 per square foot, a 5% uptick over the Q4 2013 finish of $46.47 and 4% higher than the $46.87 per square foot average one year ago.
But the re-pricing trend was particularly noteworthy, said Turchin. “The volume of space being re-priced is remarkable. Midtown South is the most likely candidate but Downtown has been the most aggressive, with a lot of landlords there saying their space wasn't priced correctly so they're re-doing it. “
A total of 1.5 million square feet of space Downtown was re-priced in the quarter, nearly double the amount of re-pricing done in Midtown—with most of the re-calculation moving rents up.
“Asking rents moved higher in 19 of the 20 re-pricings Downtown,” reported Turchin. “Midtown South also saw 80% of its re-pricings move up, while Midtown was split 50-50. Overall, we are continuing to see a great deal of leasing activity in Manhattan and there is usually a lag between increased activity and the re-pricing of rents. We are in the re-pricing phase of the market.”
Want to continue reading?
Become a Free ALM Digital Reader.
Once you are an ALM Digital Member, you’ll receive:
- Breaking commercial real estate news and analysis, on-site and via our newsletters and custom alerts
- Educational webcasts, white papers, and ebooks from industry thought leaders
- Critical coverage of the property casualty insurance and financial advisory markets on our other ALM sites, PropertyCasualty360 and ThinkAdvisor
Already have an account? Sign In Now
*May exclude premium content© 2025 ALM Global, LLC, All Rights Reserved. Request academic re-use from www.copyright.com. All other uses, submit a request to [email protected]. For more information visit Asset & Logo Licensing.


