© 2024 ALM Global, LLC, All Rights Reserved. Request academic re-use from www.copyright.com. All other uses, submit a request to [email protected]. For more information visit Asset & Logo Licensing.
Trending Stories
Events
- GlobeSt. Multifamily Spring 2025 April 01, 2025 - New YorkJoin the industry's top owners, investors, developers, brokers & financiers at THE MULTIFAMILY EVENT OF THE YEAR!More Information
- GlobeSt. Net Lease Spring 2025 April 01, 2025 - New YorkThis conference brings together the industry's most influential & knowledgeable real estate executives from the net lease sector.More Information
- Real EstateGlobeSt. ELITE Women of Influence (WOI) 2025July 21, 2025 - DenverGlobeSt. Women of Influence Conference celebrates the women who drive the commercial real estate industry forward.More Information
Recommended Stories
Leveraging Lessons from the Downturn: Retail Real Estate Experts Share Key Takeaways for 2025
By John Manganaro, Sponsored By SRS Real Estate Partners | December 20, 2024
Recent volatility in capital markets has created a challenging environment for investors. It has also created opportunities for those who can adapt their strategies to the changing fundamentals.
Developers Can’t Keep Putting Off Decarbonization
By Erik Sherman | December 20, 2024
Buildings are a significant creator of greenhouse gas emissions.
Empty Offices to Become 1M SF Medical Hub in Santa Clara
By Jack Rogers | December 20, 2024
Sutter Health, Sobrato Organization to transform two campuses.
Resource Center

Assessment
Sponsored by Cherre
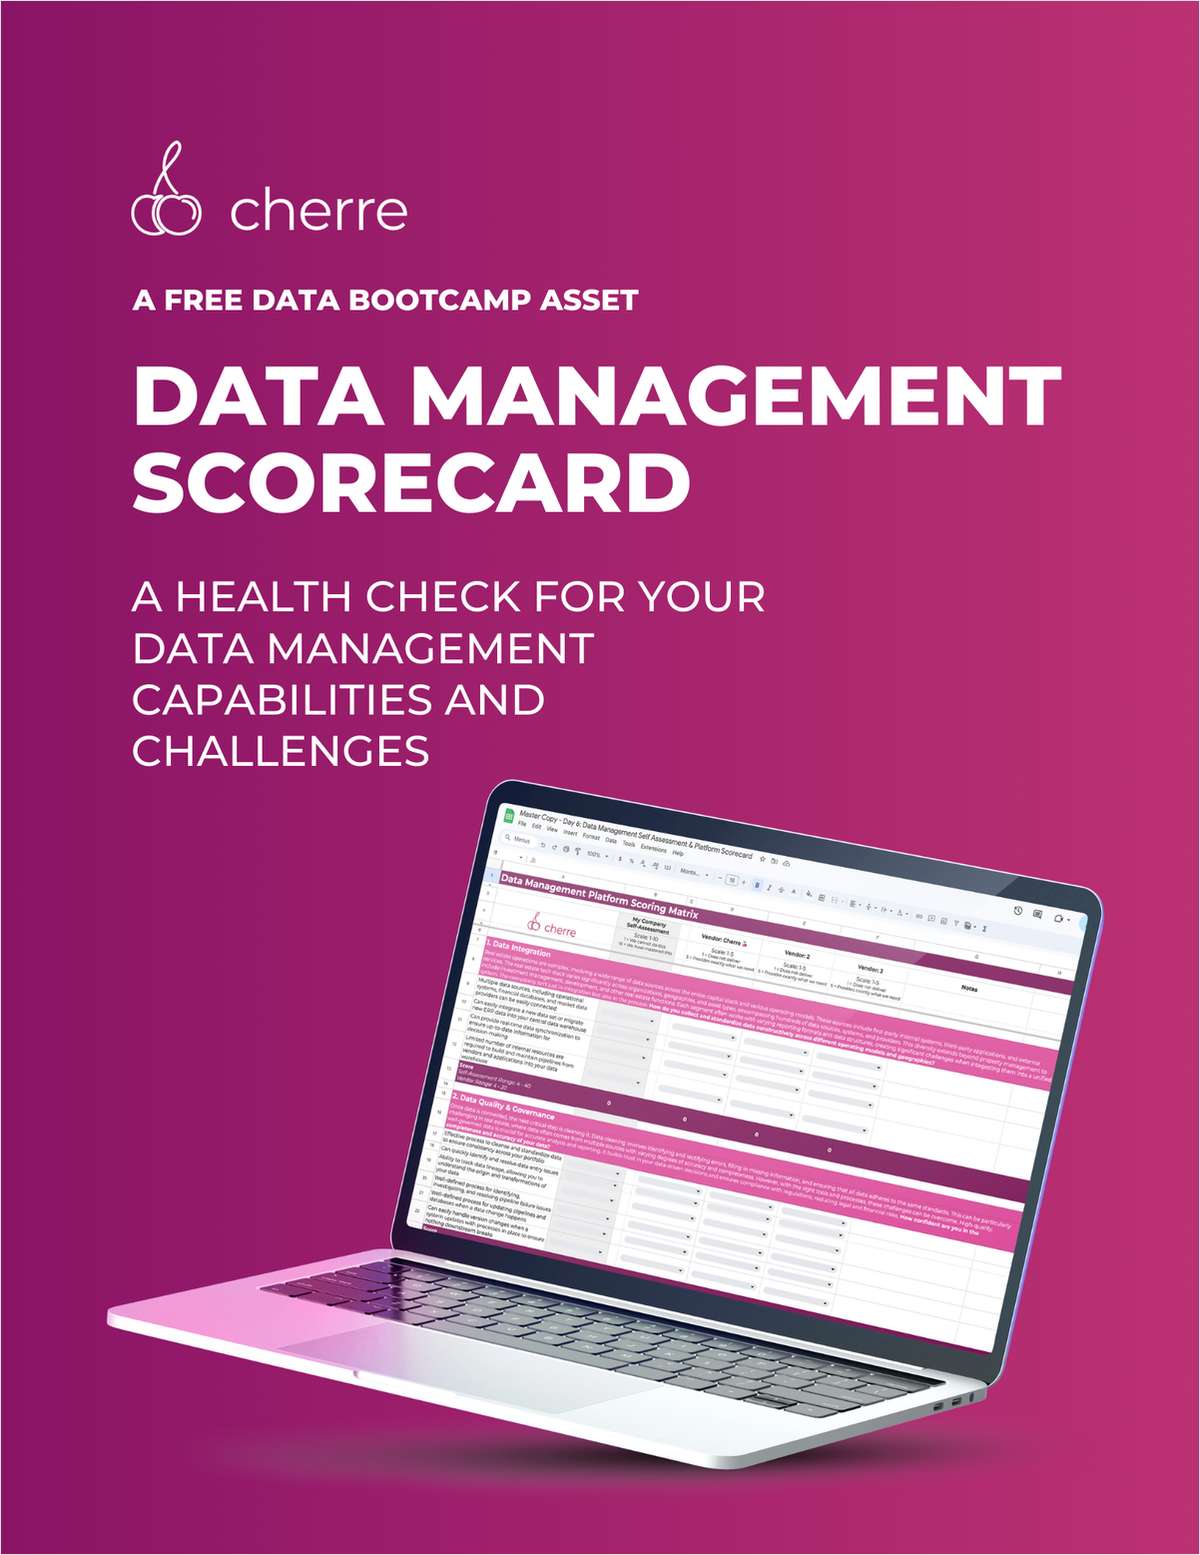
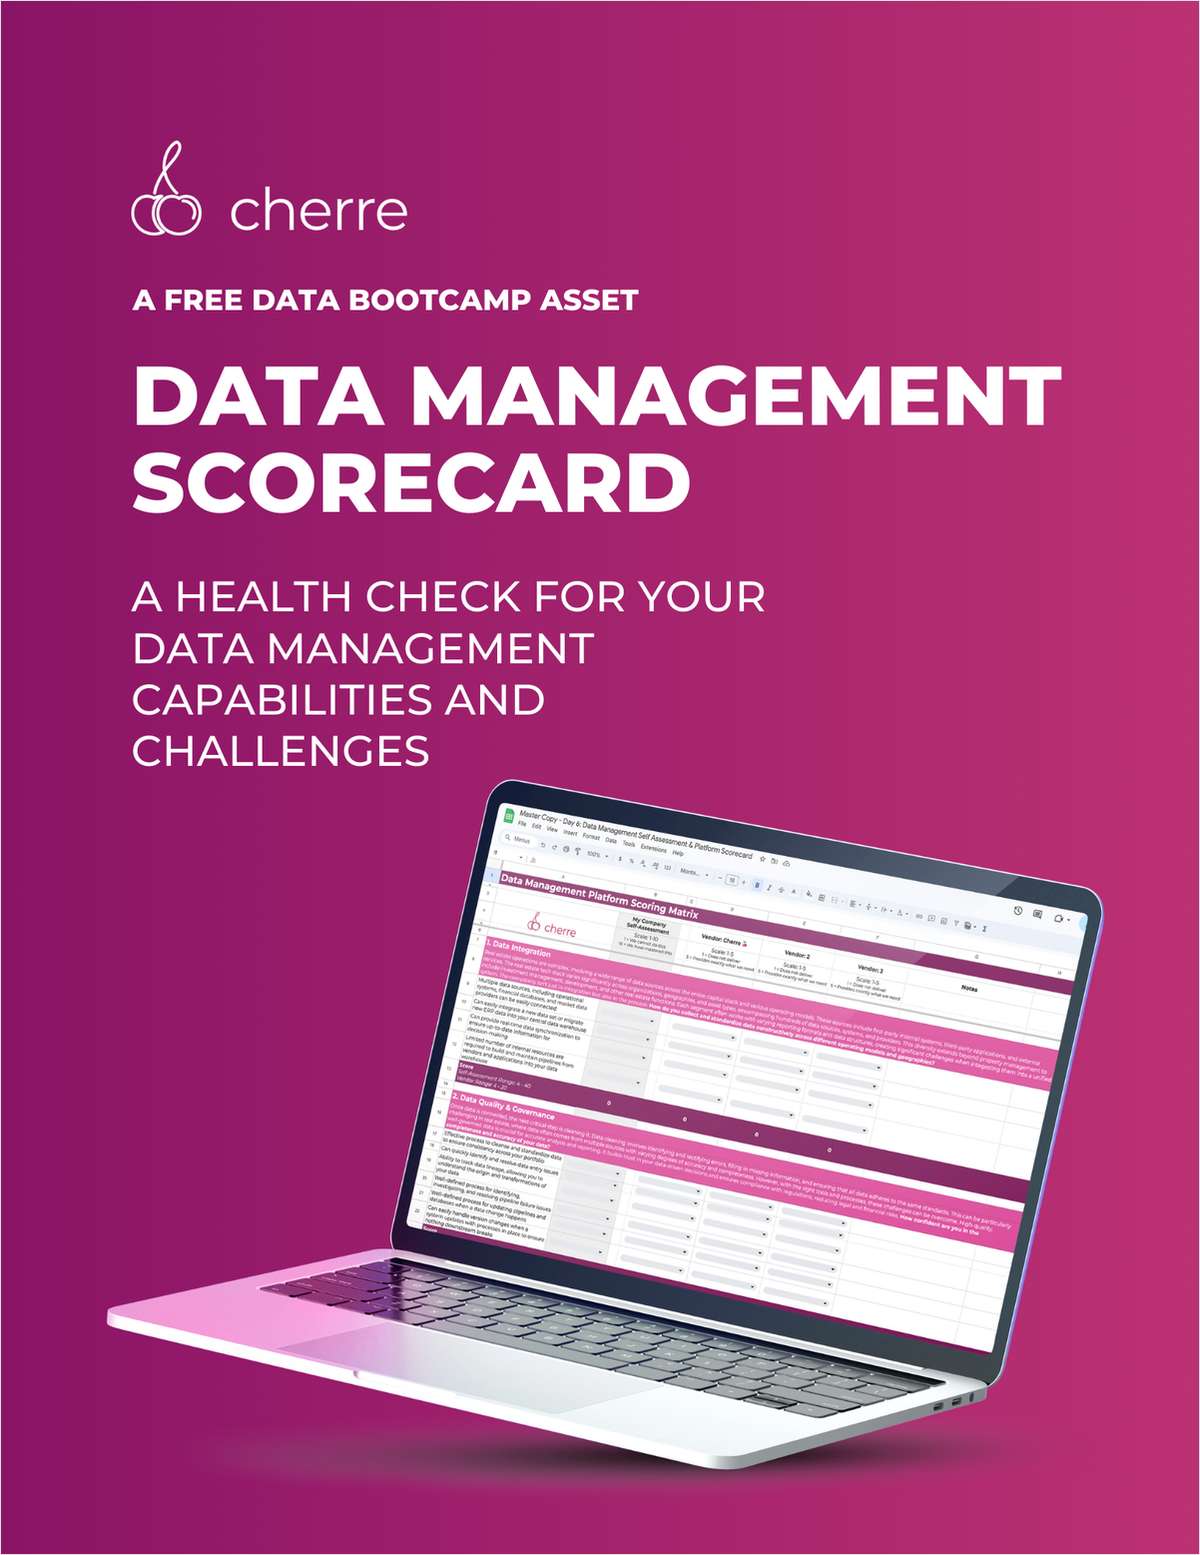
Data Management Scorecard: A Health Check for Your Data Management Capabilities and Challenges
CRE strategies and business decisions are only as strong as the data that powers them, and that data better be correct. This self-assessment will help you gauge your current data management capabilities.

Assessment
Sponsored by Cherre
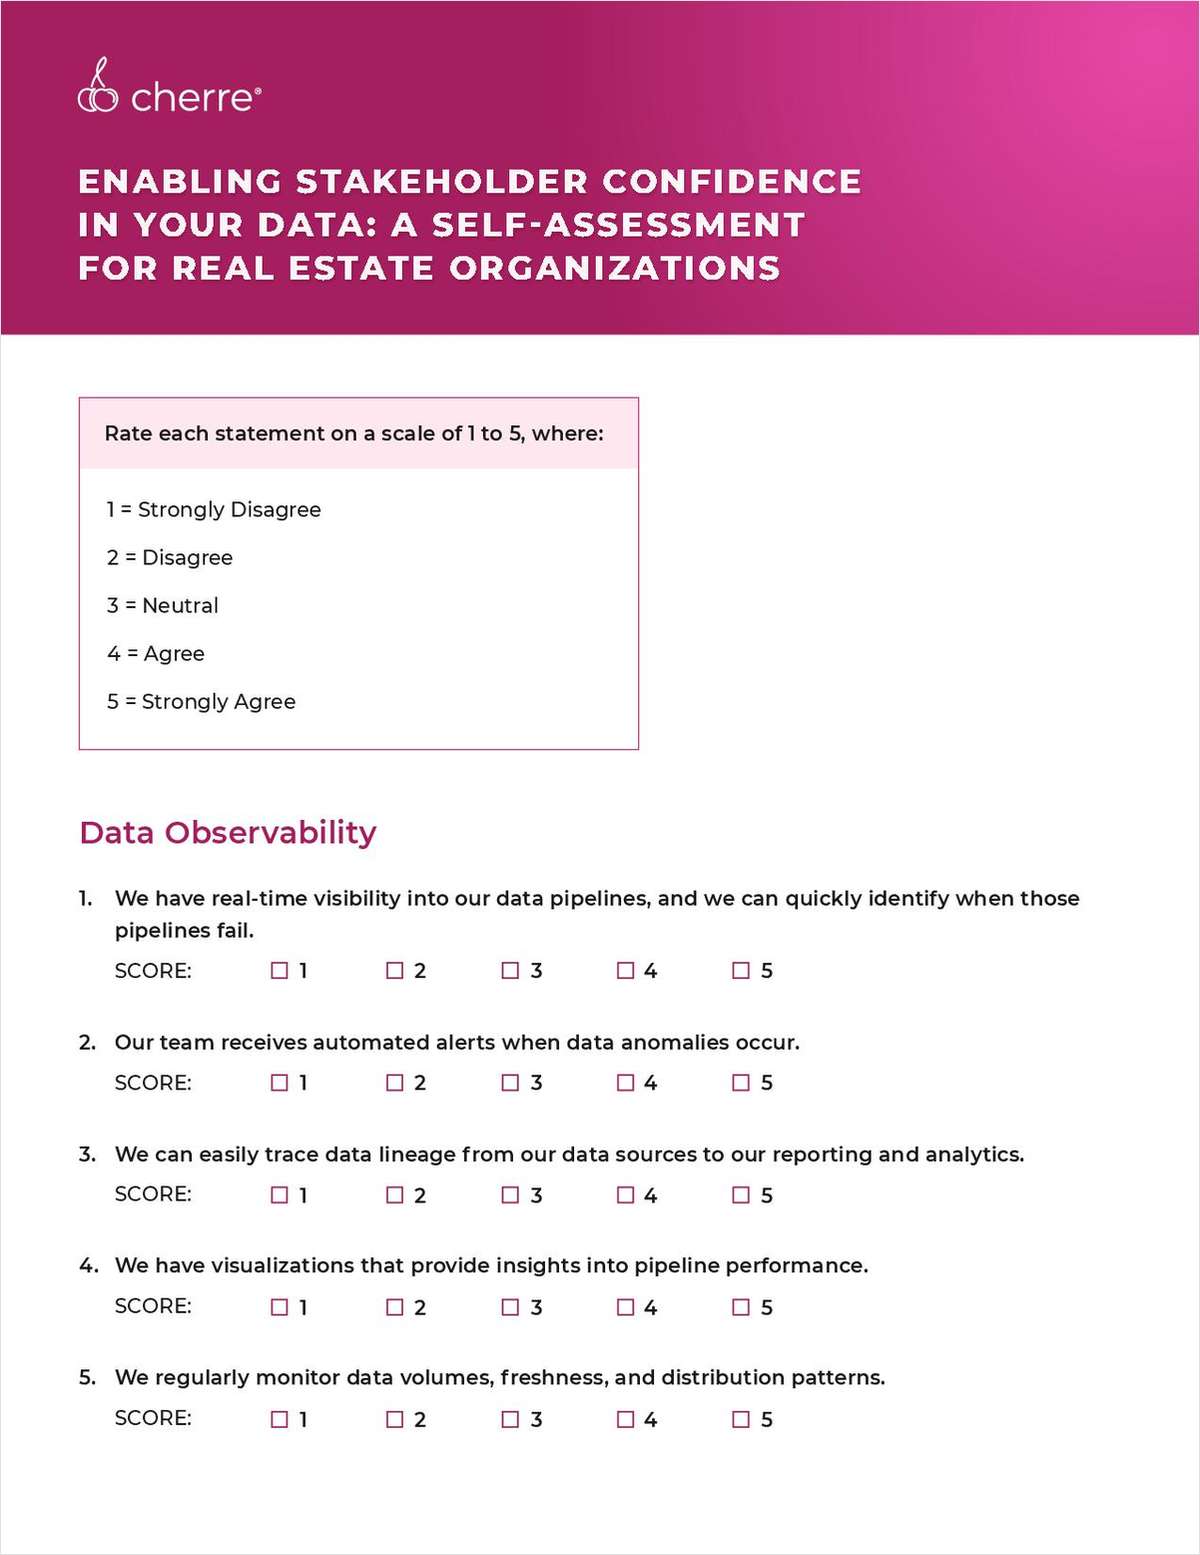
Enabling Stakeholder Confidence in Your Data: A Self-Assessment for Real Estate Organizations
Does your data inspire confidence or is there a significant lack of trust in its validity? Use this assessment to gauge where your organization’s data practices are at today and what gaps exist.


