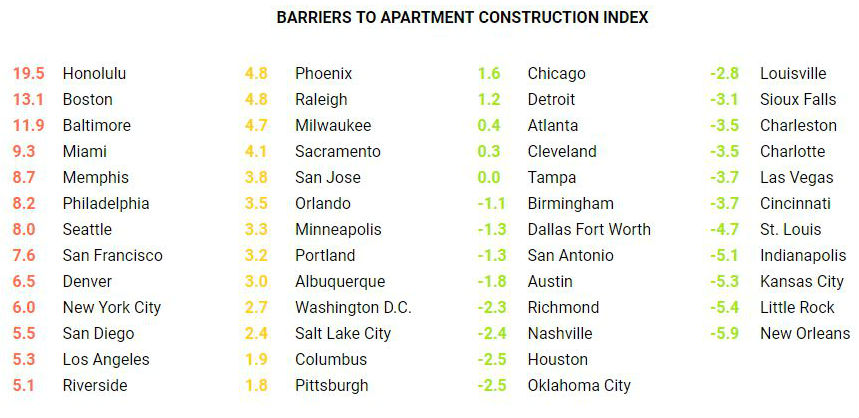
WASHINGTON, DC–A new index has been developed that calculates the difficulty of building new apartments in 50 metro areas in the US. Called the Barriers to Apartment Construction Index, it takes into account a wide range of factors including local regulations, the amount of land to develop and the prevalence of “Not in My Backyard” activity, or NIMBY-ism.
The index is part of a larger body of research by Hoyt Advisory Services that was
commissioned by the National Apartment Association and National Multifamily Housing Council.
It is the product of two existing indexes — the Wharton Regulatory Index and the LaCroix Natural Supply Limits Index, Caitlin Walter, director of Research for the National Multifamily Housing Council tells GlobeSt.com.
The index reflects a range environments for apartment building, she says, with Honolulu the most difficult and New Orleans the easiest.
The scoring is not the most intuitive; many indexes use a one-to-100 ranking system with 50 being the break-even point, but the Barriers to Apartment Construction Index runs from 19.5, signifying the most difficult market to add apartments (which is Honolulu, as Walter said) to -5.9, where New Orleans resides. [see chart for the 50 metro market scores].
The median score is 1.8, which means any area with a score above that is harder to add new apartments compared to other metro areas.
Petitioning The Policy-Makers
There are many reasons why building apartments has become difficult in so many markets, according to NMHC Chair Bob DeWitt. “Over the past three decades, not only have hard costs like land and materials risen sharply, but regulatory barriers to apartment construction have also increased significantly, most notably at the local level,” he says.
Regulatory barriers include outdated zoning laws, unnecessary land use restrictions, arbitrary permitting requirements, inflated parking requirements and environmental site assessments.
That the index is able to quantify the various factors including NIMBY-ism is fascinating — and could prove to be very useful as the industry and individuals petition their lawmakers for relief, says Paula Munger, director of research for NAA.
“These are numbers a developer can take to a policy maker and say 'here is how we can make some changes,'” she tells GlobeSt.com.

© 2025 ALM Global, LLC, All Rights Reserved. Request academic re-use from www.copyright.com. All other uses, submit a request to [email protected]. For more information visit Asset & Logo Licensing.


