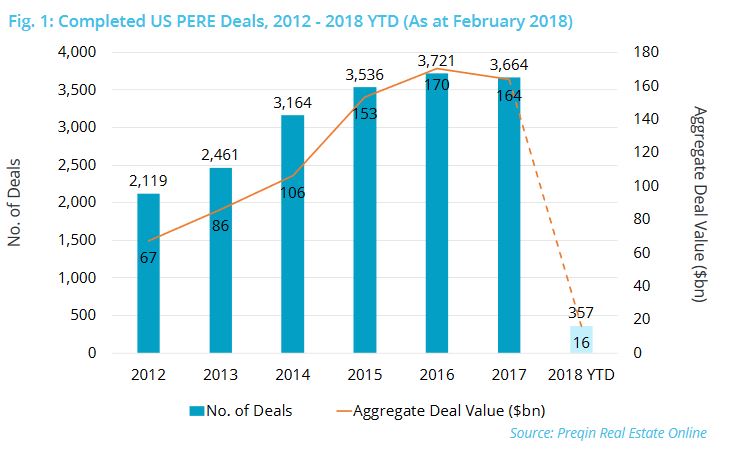
LONDON–2017 was a strong year — albeit not the strongest — for private equity real estate investments in the US, with 3,664 transactions completed for a total of $164 billion, according to an analysis by Preqin that was recently published in its March Real Estate Spotlight. However, fund managers voiced a familiar concern about the deal flow — finding attractively-priced assets has been and continues to be a challenge. Thus, fund managers have been more willing to expand their search to less saturated markets.
Preqin's analysis found that assets in the West and northeast US regions accounted for the greatest proportions of deal value last year at 30% and 27% respectively. This activity was largely driven by deals in California and New York.
Sliced another way, the data also show that states in the southeast — Florida and the Carolinas — represented the greatest number of deals completed last year, at 1,052 or 29%. This amounted to roughly twice as many as any other region with the exception of the West.
Preqin also noted that at 88% single-asset deals represented the vast majority of completed transactions in 2017 and that each region generally kept in line with this national average. However, in terms of value, there were some departures. Single-asset deals in the West represented 88% of deal value. At the same time, portfolio deals had far greater aggregate deal value in the southwest and Midwest. Preqin noted that roughly two in five deals in these regions involved a portfolio sale and it posited that this was likely driven by the greater availability of assets outside the northeast and Western markets.
Other stats from the Preqin report:
- Over one-quarter, or 38%, of all deals for the northeast involved office properties. Preqin thinks this was likely driven by higher prices for office assets in this region.
- Residential deals dominated the south: in the southwest these deals comprised 45% of all deals and in the southeast, it was 42%. Residential assets accounted for half of the southeast's total deal value, partly because the region had the lowest average regional prices.
- Hotel prices in the West and northeast were significantly higher than in other regions, thanks to California and New York's tourism industries.
- The Midwest was the least dominated by office and residential assets, with these property types representing 49% of all deals and 58% of aggregate deal value.
More Proof Fund Managers Go Beyond Their Roots
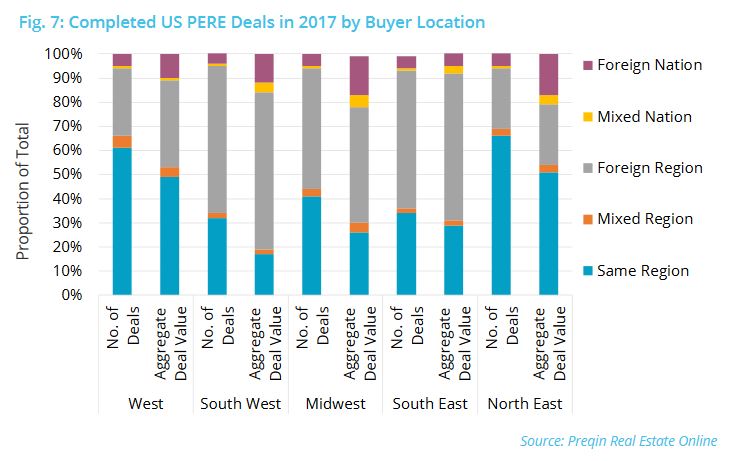
Preqin also looked into the origins of the buying funds and its findings bolstered its premise that fund managers were expanding beyond their own neighborhoods. While roughly two-thirds of deals for properties in the northeast and West involved fund managers based in these regions, the majority of deals in the southwest, Midwest and southeast did not involve a fund manager there.
Preqin writes that:
It is interesting to note that in each of the five regions, the proportion of deals accounted for by fund managers based in the region is greater than the share of aggregate deal value these managers represent. This indicates that domestic managers typically acquire lower-priced assets than managers investing in the region from elsewhere, potentially due to the local expertise of the domestic managers.
The majority, or 51%, of northeast deal value originated from within the region, for the highest level of domestic investment in all regions. The northeast also recorded the greatest proportion of investment from international managers at 17% of annual deal.
Preqin also noted that foreign-based fund managers typically pay higher prices for US assets. The northeast showed the greatest disparity in average value while assets in the southeast remained similarly priced no matter where the fund manager was located.
Want to continue reading?
Become a Free ALM Digital Reader.
Once you are an ALM Digital Member, you’ll receive:
- Breaking commercial real estate news and analysis, on-site and via our newsletters and custom alerts
- Educational webcasts, white papers, and ebooks from industry thought leaders
- Critical coverage of the property casualty insurance and financial advisory markets on our other ALM sites, PropertyCasualty360 and ThinkAdvisor
Already have an account? Sign In Now
*May exclude premium content© 2025 ALM Global, LLC, All Rights Reserved. Request academic re-use from www.copyright.com. All other uses, submit a request to [email protected]. For more information visit Asset & Logo Licensing.


