 At CRE Field, New York and Boston play ball!
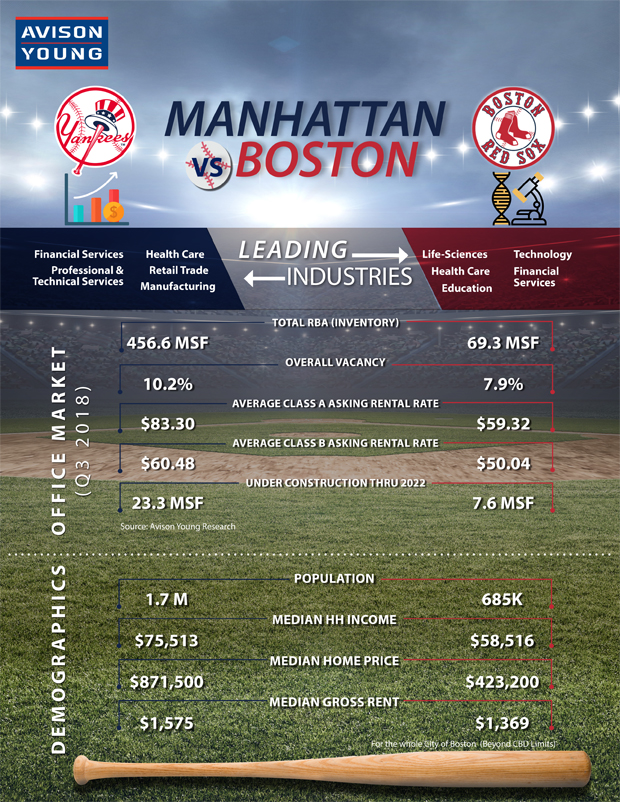
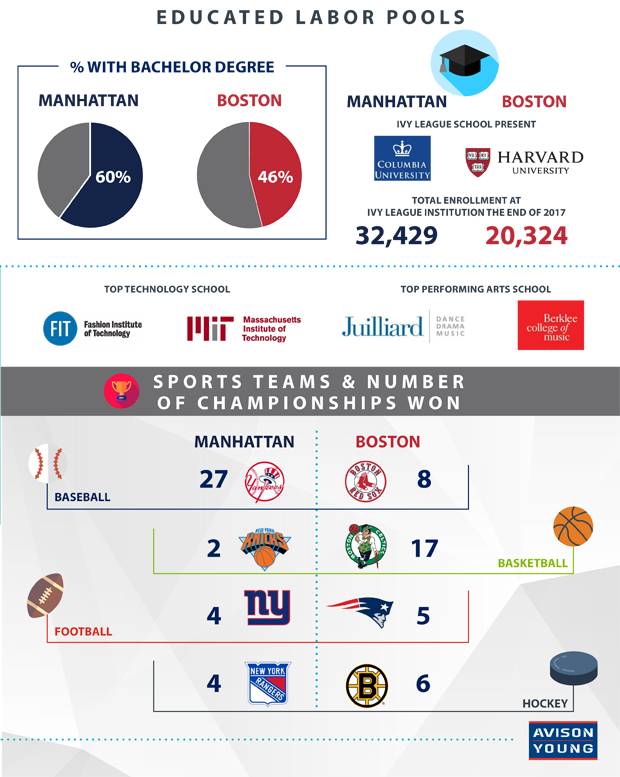
It's time to play ball both on the diamond and in the field of real estate. With Major League Baseball's American League division games, it's Manhattan vs. Boston. With that in mind, Avison Young takes a look at how these cities stack up. The stats show in the office market, New York City leads with 456.6 million square feet compared to Boston's 69.3 million square feet. The median home price for the Big Apple is $871,500 compared to Bean Town's $423,200. But check out the brokerage's full infographic below to take a closer look at these two rivals. For example, which city is ranked higher for millennials and for tech innovation? Read on.


© 2025 ALM Global, LLC, All Rights Reserved. Request academic re-use from www.copyright.com. All other uses, submit a request to asset-and-logo-licensing@alm.com. For more information visit Asset & Logo Licensing.


