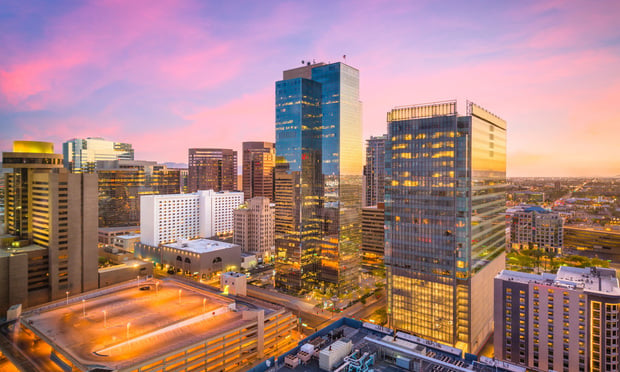
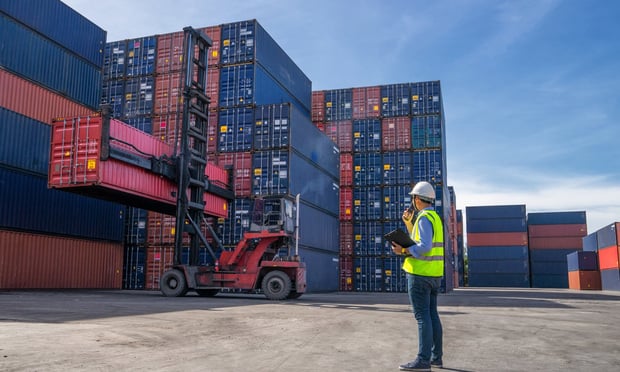
 Like all things Phoenix these days, the industrial market is on fire. Ecommerce is driving leasing activity and helping to drive vacancy rates to record lows of 7.2% and rental rates to record highs of $0.59, according to the latest report from Kidder Mathews. Last year was a particularly strong year for industrial activity in Phoenix with 7.5 million square feet in net absorption, and while reports forecast strong activity in 2019, it might not match 2018 volumes.
“While we think it will be a strong year, we don't know if it will be as active as 2018,” Eric Bell, SVP and industrial specialist at Kidder Mathews, tells GlobeSt.com. “Many companies and developers were planning for a slowdown in the economy within the next 18 to 24 months and are making decisions accordingly.”
Like other markets, ecommerce, third-party logistics users and distribution centers have been a major driver of activity in Phoenix, especially as the population grows. “E-commerce continues to drive activity in the Phoenix area while the strong housing market is propelling the service providers in the construction industry,” adds Bell. “The rental rates are a function of high demand and also increases in construction costs.”
While this is a strong driver of demand, construction activity might be outpacing it, and it could lead to a bump in vacancy. According to the Kidder Mathews report, 8 million square feet in new construction will deliver by the end of this year. Still, users are currently moving to areas with new product, like the Southwest Valley. The submarket has the highest vacancy rate in Phoenix and the highest net absorption in the first quarter. “The Southwest Valley has been the most active, with just under 700,000 square feet of net absorption,” says Bell. “The availability of larger distribution spaces with proximity to I-10 and the Southern California markets makes the Southwest Valley very desirable.”
While demand remains strong, capital is continuing to chase industrial deals in the market. Last year, sales volumes hit record highs of $2.2 billion. “The year over year population growth and employment rates have driven new investors to the market seeking stable assets,” adds Bell. “New capital, much of which is 1031 exchange money, is arriving every day from west coast cities seeking more attractive cap rates. In addition we are also now seeing sellers of other product types trying to exchange into industrial for the stability.” Last quarter, however, sales volumes where slightly down year-over-year with 3.5 million square feet trading hands compared to 4.6 million square feet in the first quarter 2018.
Want to continue reading?
Become a Free ALM Digital Reader.
Once you are an ALM Digital Member, you’ll receive:
- Breaking commercial real estate news and analysis, on-site and via our newsletters and custom alerts
- Educational webcasts, white papers, and ebooks from industry thought leaders
- Critical coverage of the property casualty insurance and financial advisory markets on our other ALM sites, PropertyCasualty360 and ThinkAdvisor
Already have an account? Sign In Now
*May exclude premium content© 2025 ALM Global, LLC, All Rights Reserved. Request academic re-use from www.copyright.com. All other uses, submit a request to [email protected]. For more information visit Asset & Logo Licensing.


