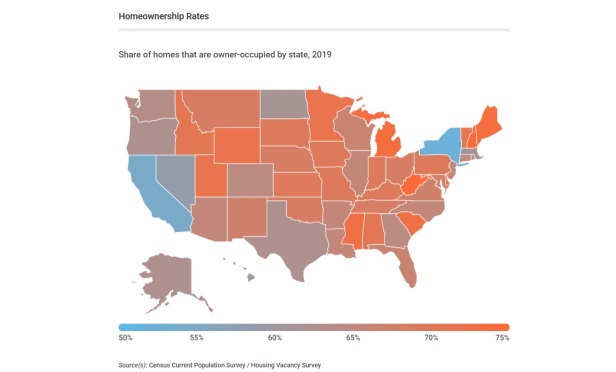
 About 65% of US homes are owner-occupied today, only 2% more than in 1965, according to the Census.
SEATTLE—While the Great Recession of 2007-2009 was short-lived, its effects stretched much longer. A major contributor to the crash was a deceptively unstable mortgage market.
At that time, the economy seemed strong, interest rates were low and mortgage lenders were open to lending to subprime candidates. However, a spike in subprime mortgages also meant banks were lending to risky borrowers who are more likely to default on loan payments.
Leading up to the financial crisis were many red flags coupled with economic growth. But, investors were convinced homes would continue to appreciate in value despite the warning signs, according to free online service Clever Real Estate.
This has left many suspicious of recent growth and wondering whether another crash is unavoidable. To determine whether concerns about another crash are warranted, Clever Real Estate investigated the housing and mortgage markets leading up to and since the Great Recession.
According to the Fed, Baby Boomers owned about 21% of the nation's wealth in 1989 when they were 25 to 34 years old. Conversely, Millennials only owned 3% of the nation's wealth in 2019. And 30 to 39-year-olds held two times as much debt in 2019 than in 1999.
Homeownership rates began to fall in 2005 and continued to do so for the next decade. According to the Consumer Financial Protection Bureau's mortgage inquiry index which measures the number of loan applications relative to January 2009, mortgage inquiries dropped significantly between 2009 and 2014. During that time, there were less than half of the number of inquiries, hitting a 50-year low in 2015.
In late 2008, the Federal Reserve dropped federal funds rates to previously record lows ranging between 0 and 0.25%, suggesting that "weak economic conditions are likely to warrant exceptionally low levels of the federal funds rate for some time". Drops in mortgage interest rates–while not directly caused by low federal funds rates–followed suit.
Mortgage interest rates for 30-year fixed-rate loans have been steadily decreasing since the peak in 1981 when rates crept up to more than 18.6% or 5.3 times today's rates and have lived under 5% since 2009 as a direct result of the financial crisis.
There was an uptick in inquiries in late 2018 through much of 2019, likely due to historically low interest rates, according to Clever Real Estate. Homeownership rates are back on the rise, which has sparked concern, but homeownership is usually a good sign for the economy, especially when coupled with low unemployment rates.
Rates have recently continued to fall as a result of the coronavirus. As of the week of March 5, 30-year fixed rates were at 3.29% or 16 points lower than the previous week.
The housing market has largely recovered since the 2008 financial crisis, but recent lifts on lending restrictions and low interest rates might put the industry at risk for market corrections. Moreover, while the largest share of mortgage down payments are within the 20% to 40% range, the proportion of down payments less than 20% has increased 75% since 2008. The average debt-to-income ratio dropped 22% in the decade following the crash, but still remains high (97%). These are cause for concern, some experts warn. Seattle seems to have bounced back more favorably than other areas, according to Francesca Ortegren, research associate/data scientist at Clever Real Estate.
"Median home listing price in Seattle metro is $600,050 or about $300 per square foot," Ortegren tells GlobeSt.com. "That's compared to the national median listing price of $243,560. The median listing price varies by principal city as well, Bellevue homes are about $737,000, Seattle $605,200 and Tacoma are much lower at $250,400."
Seattle wasn't hit much harder than the nation overall in terms of underwater mortgage rates, says Ortegren, with 25% of mortgages in the metro underwater in 2010 (compared to 22% nationally) but have since recovered. There are 5% underwater in Seattle versus 9% nationally.
"That's an 80% decrease in underwater mortgages, i.e., negative equity, between 2010 and 2018," she tells GlobeSt.com. "In Washington, the share of homes with negative equity is about 1.5%, down from 16.8% in 2010. Homeownership rates in Washington, 64%, are similar to the national average, 65%, but those in the Seattle metro are a bit lower at 60%. Homeownership rates are a bit lower in Seattle proper (46%) than in Tacoma (51%) or Bellevue (56%). Monthly home-related costs for homes with a mortgage are about $2,500 in Seattle, compared to $1,500 nationwide."
Clever's sources for its study were St. Louis Federal Reserve Database, the Census, CoreLogic, the Federal Reserve Bank of New York, Federal Reserve, The Federal Housing Finance Agency, the Consumer Financial Protection Bureau, Freddie Mac, Zillow Home Value Index and the Realtor.com.
© Touchpoint Markets, All Rights Reserved. Request academic re-use from www.copyright.com. All other uses, submit a request to [email protected]. For more inforrmation visit Asset & Logo Licensing.


